
Sarah and Peter were working on designing a mission strategy for the Robot Game. Below is what they came up with.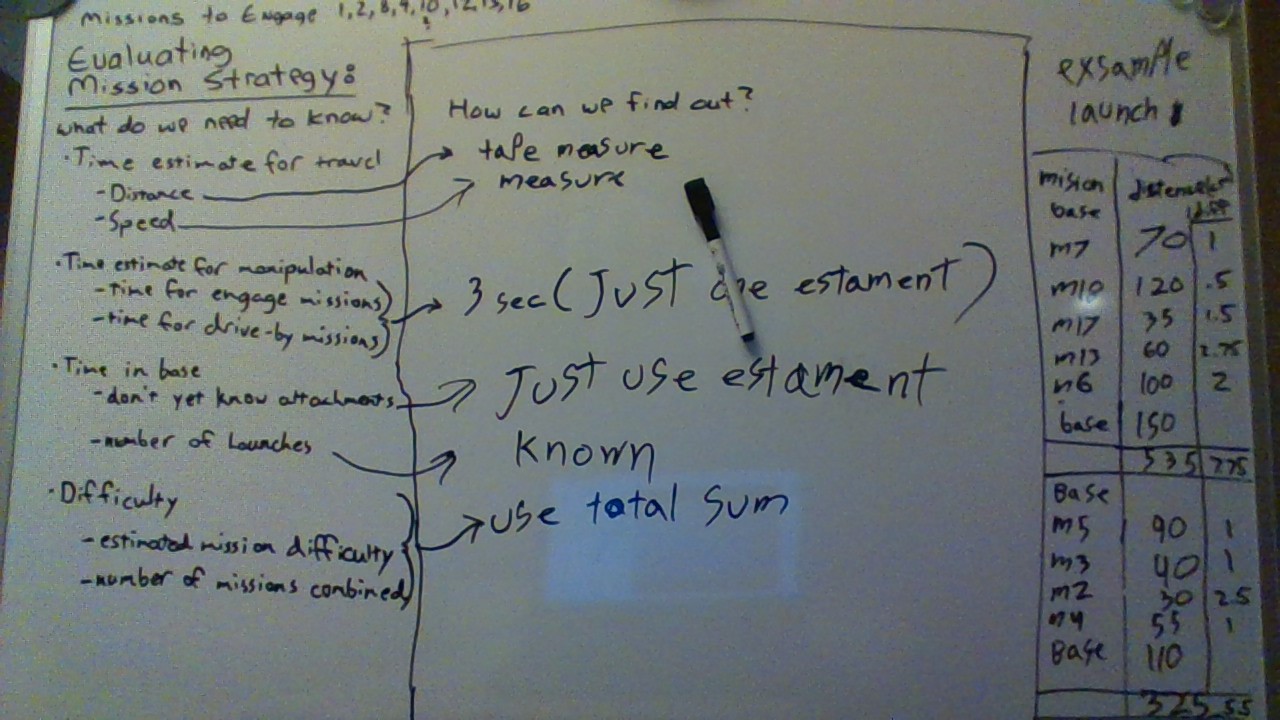
On the left you will see a list of the things that they thought were necessary to evaluate if their Robot Game strategy was something the team could accomplish. The middle column is a list of how they went about finding the data they needed. The set of 3 columns on the far right was two examples of launches showing the collected data to evaluate if the strategy would accomplish their goals.
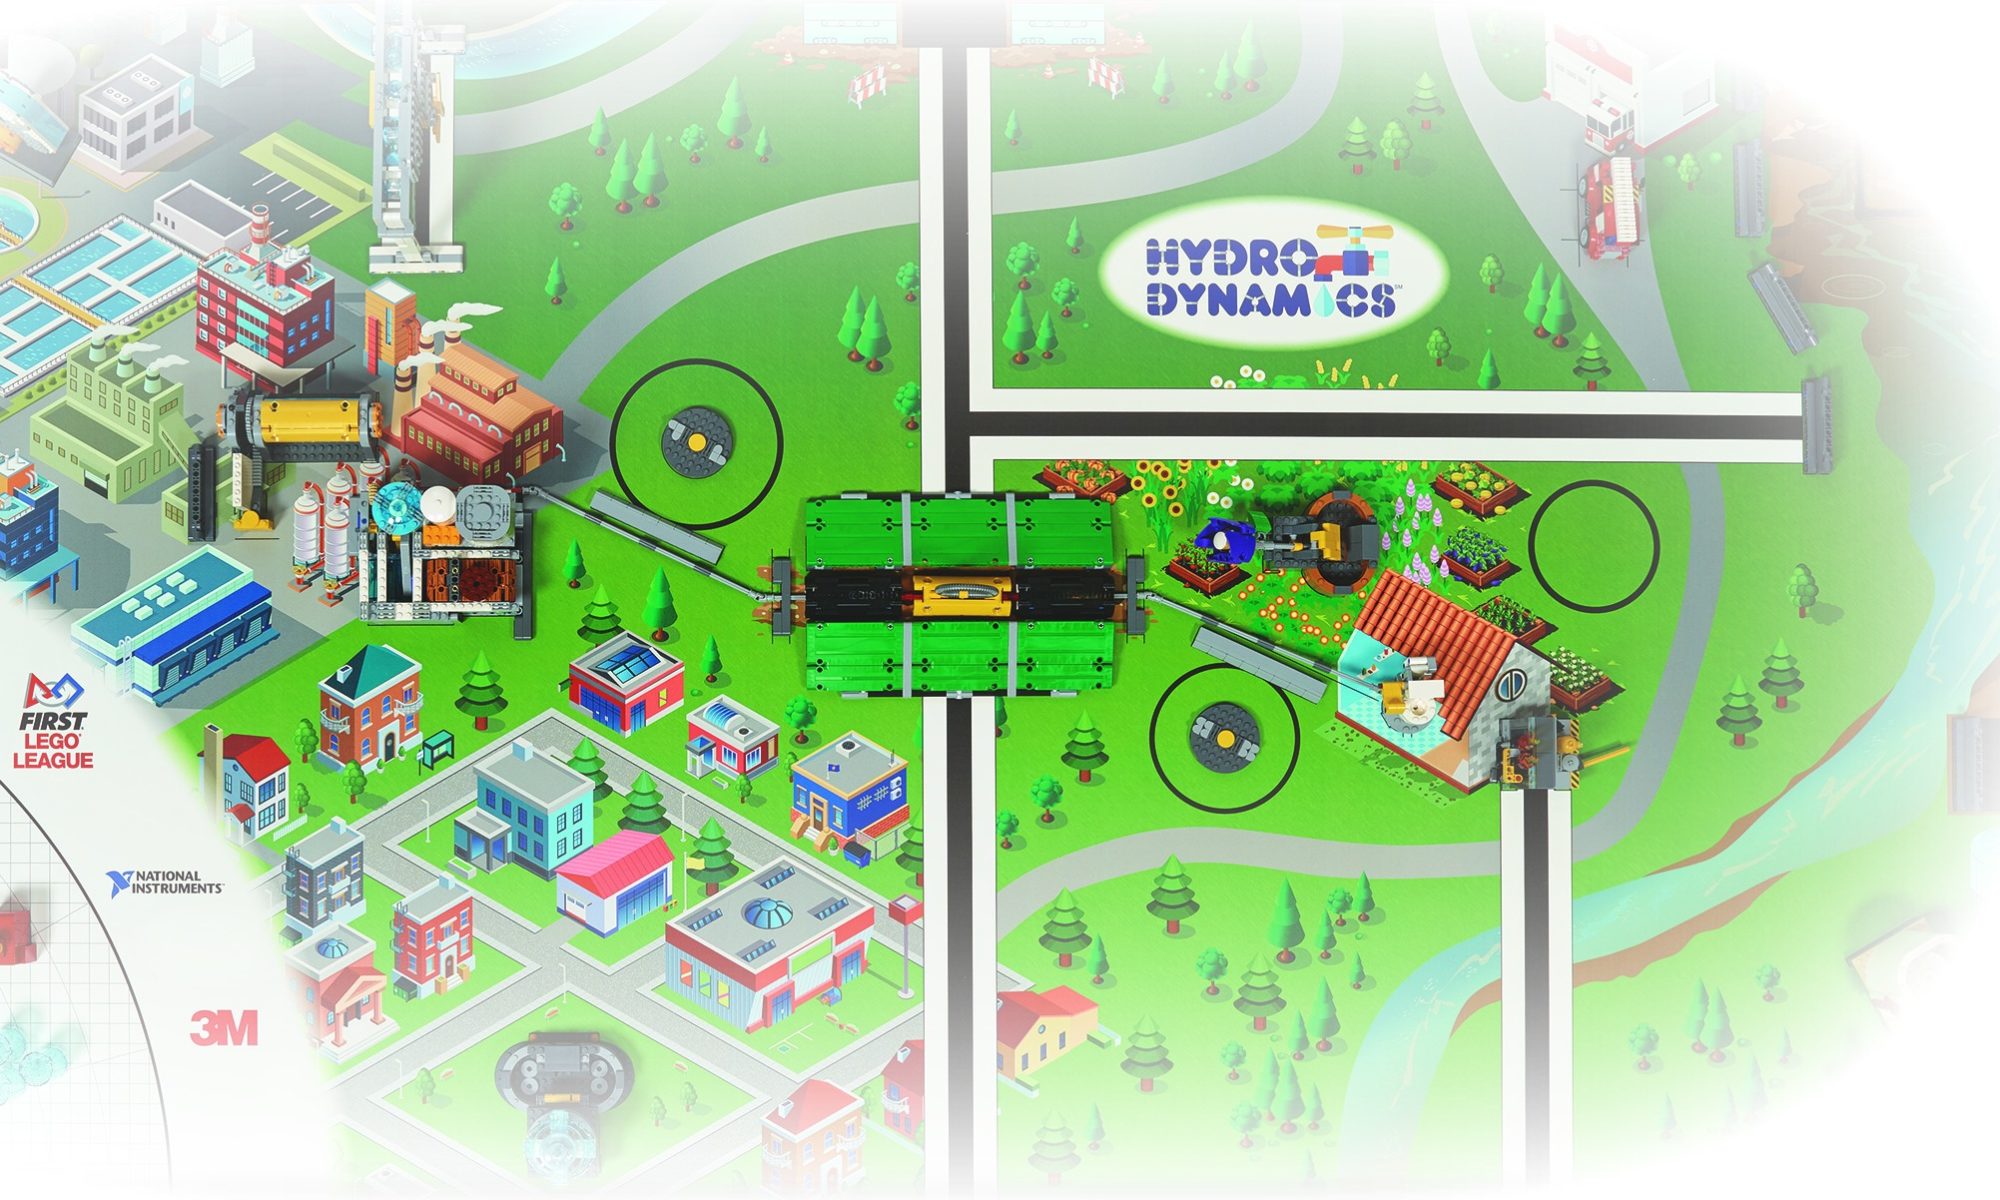
This shows a Robot Game strategy that consists of 2 robot launches as defined by Definition D08 in the Hydro Dynamics Challenge Guide. The first launch has the robot go from base to M07 ( the fountain ) on to M18 ( the faucet ) on to M17 ( the slingshot target ) on to M13 ( the flower ) on to M06 ( the toilet ) and finally back to base. The distance between each mission was measured and the total is 535 cm. The difficulty of each mission was also added up which gives a total difficulty of 7.75. You can work out what the second launch would do if you like.
Once a possible launch sequence has been planned, the total distance can be used to estimate how long it will take the robot to perform all of the actions. Here is where a picture is worth a thousand words.
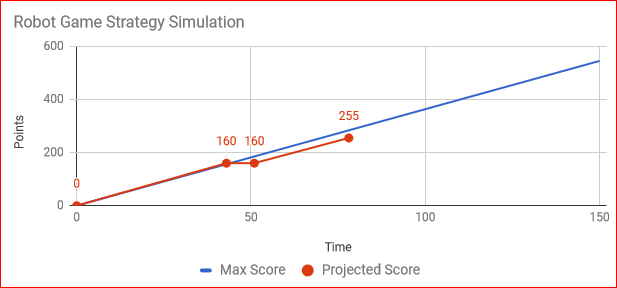
This graph shows a blue line which tracks the maximum points possible over the course of the 2 1/2 minute robot game. The red line shows the two launches that were shown on the whiteboard picture above. The total distance was converted to time using the speed of the robot. ( Big Big Big disclaimer – the speed of the robot was guessed and needs to be measured for real ) In addition, Sarah and Peter used a guess of about 8 seconds to reconfigure the robot in base and relaunch it between the first and second launch.
This is only a rough guess at the feasibility of the robot game strategy but it should help you to identify plans that definitely will not work. It will also point out plans where the points accumulated are very low when compared to the time taken to accumulate them.
Since it is a little time consuming to measure all of the distances, convert them to time, add up difficulties and graph everything, we have provided a Google spreadsheet here which will take care of most of the number crunching.
The first tab – Configurable Items – has a few things that you can adjust if you want to see the impact of some of Sarah and Peters estimates. Then you can switch to the tab – Mission Modeling. On this tab you will find boxes which allow you to input the mission order on a per launch basis. As you fill in the launches, the graph of points over time at the top of the page will be updated. If you change your mind, just delete the waypoints for a given launch and enter new ones.
Feel free to play around with it if you find it useful for visualizing the results of your planned robot game strategy.